Introduction
In the realm of project management, Gantt charts stand as indispensable tools for visualizing project timelines. In this article, we will not only guide you through the process of creating a Gantt chart in PowerPoint but also explore the integration of cutting-edge technology from Inno Helper – the AI PowerPoint generator. By combining traditional project management techniques with the innovative power of AI, you can elevate your project planning and presentation skills to new heights.
Understanding the Basics of a Gantt Chart
A Gantt chart provides a comprehensive overview of project schedules, making it easier to manage tasks, track progress, and allocate resources effectively. Each task is represented by a bar, displaying its start and end dates, allowing for precise scheduling and coordination.
Step-by-Step Guide to Creating a Gantt Chart in PowerPoint
1. Open PowerPoint and Create a New Slide
Begin by launching PowerPoint and creating a new slide, setting the stage for your Gantt chart.
2. Insert a Stacked Bar Chart
Within the new slide, navigate to the 'Insert' tab, select 'Chart' in the Illustrations group, and opt for 'Stacked Bar Chart.' This initial step lays the foundation for your Gantt chart.
3. Enter Your Data
Replace the default data in the Excel sheet with your project-specific information. Input the tasks in the first column and their corresponding start and end dates in the subsequent columns.

4. Format the Bar Chart into a Gantt Chart
Refine the chart by adjusting the colors, bar width, and other elements, transforming it into a fully functional Gantt chart. Right-click on various chart elements and select 'Format' to make the necessary modifications.
5. Add Milestones and Dependencies
Enhance your Gantt chart by incorporating milestones and task dependencies. Utilize different shapes or colors to denote milestones and arrows to indicate dependencies, enhancing the chart's depth and clarity.
6. Label Your Axes and Add a Title
Ensure the Gantt chart is comprehensible by labeling the horizontal and vertical axes clearly. Add a descriptive title summarizing the project or task being depicted.
7. Integrating Inno Helper AI PowerPoint Generator
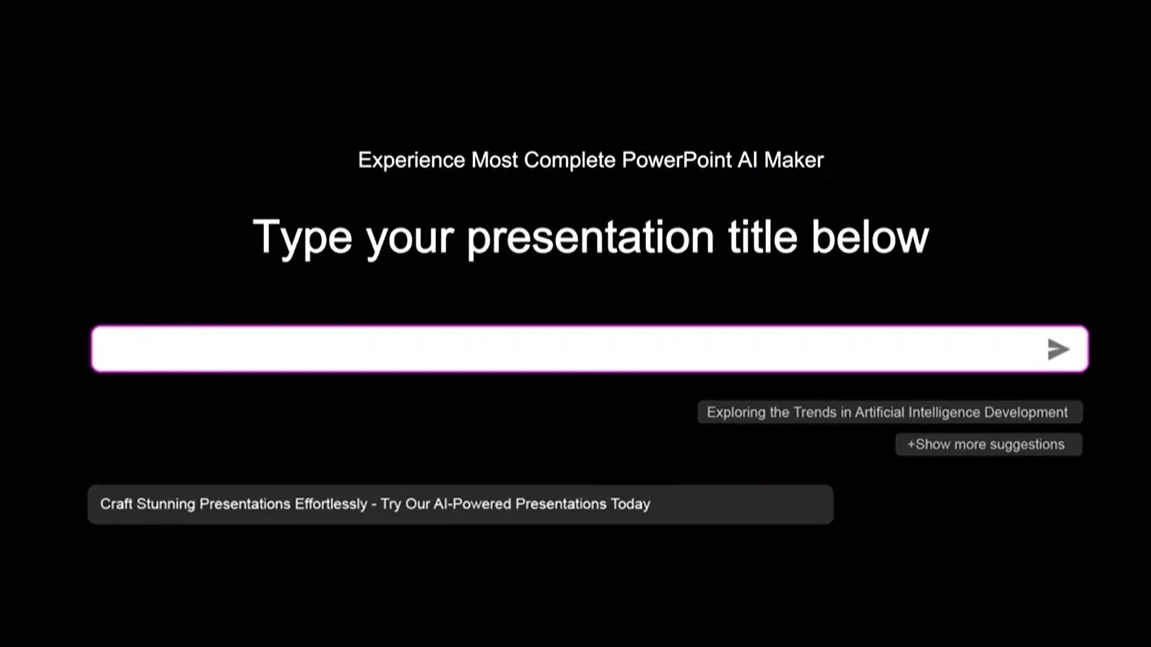
Incorporate the Inno Helper AI PowerPoint generator to infuse your presentation with innovation. Upload your Gantt chart data to the platform, allowing the AI to enhance your visualizations, suggest improvements, and create dynamic, engaging slides.
Conclusion
In conclusion, mastering the art of creating Gantt charts in PowerPoint provides a solid foundation for effective project management. By integrating the capabilities of Smallppt AI PowerPoint generator, you can revolutionize your presentations. Embrace this synergy of traditional methodology and advanced technology to communicate your ideas with precision and impact.
Frequently Asked Questions
1. What advantages does the integration of AI bring to PowerPoint presentations?
Integrating AI into PowerPoint presentations enhances visualizations, suggests improvements, and creates dynamic slides, elevating the overall quality and impact of the presentation.
2. Can I use Smallppt AI PowerPoint generator with other project management tools?
Yes, Smallppt AI PowerPoint generator is designed to be compatible with various project management tools, ensuring seamless integration and enhanced visual representations.
3. Does the AI PowerPoint generator require extensive technical knowledge to operate?
No, Smallppt AI PowerPoint generator is user-friendly, designed for individuals with varying technical expertise. Its intuitive interface guides users through the process, making it accessible to everyone.
4. Can the AI PowerPoint generator work with different types of charts besides Gantt charts?
The AI PowerPoint generator is versatile and compatible with a wide array of charts and visualizations, allowing users to enhance different aspects of their presentations.
5. How can AI-powered presentations impact business communication?
AI-powered presentations enhance business communication by making data more accessible and understandable. They enable professionals to convey complex information in a compelling manner, fostering better understanding and decision-making within organizations.

