The Step 92% of Farmers Forget in Reports: Integration with Commodity Prices
Most farmers skip a simple but crucial step in their reports—adding up-to-date commodity prices. Including real market data, like soybean or corn prices from CONAB data slides, adds context and builds trust with partners, buyers, and teams. It's one of the key benefits of using an agribusiness PPT that's automated and data-integrated.
When you show how price shifts affect your strategy, your report becomes more than numbers—it tells a real story. And with automation, these prices can be pulled into your slides automatically, saving hours and avoiding outdated info.
Template That Saved 15 Hours/Month on Soybean Farms: Demo with Real Data
Let's be honest—creating ag reports is a pain, especially for crops like soybeans. There's tons of data, long growing cycles, and endless charts to build. It can take days just to put one decent report together.
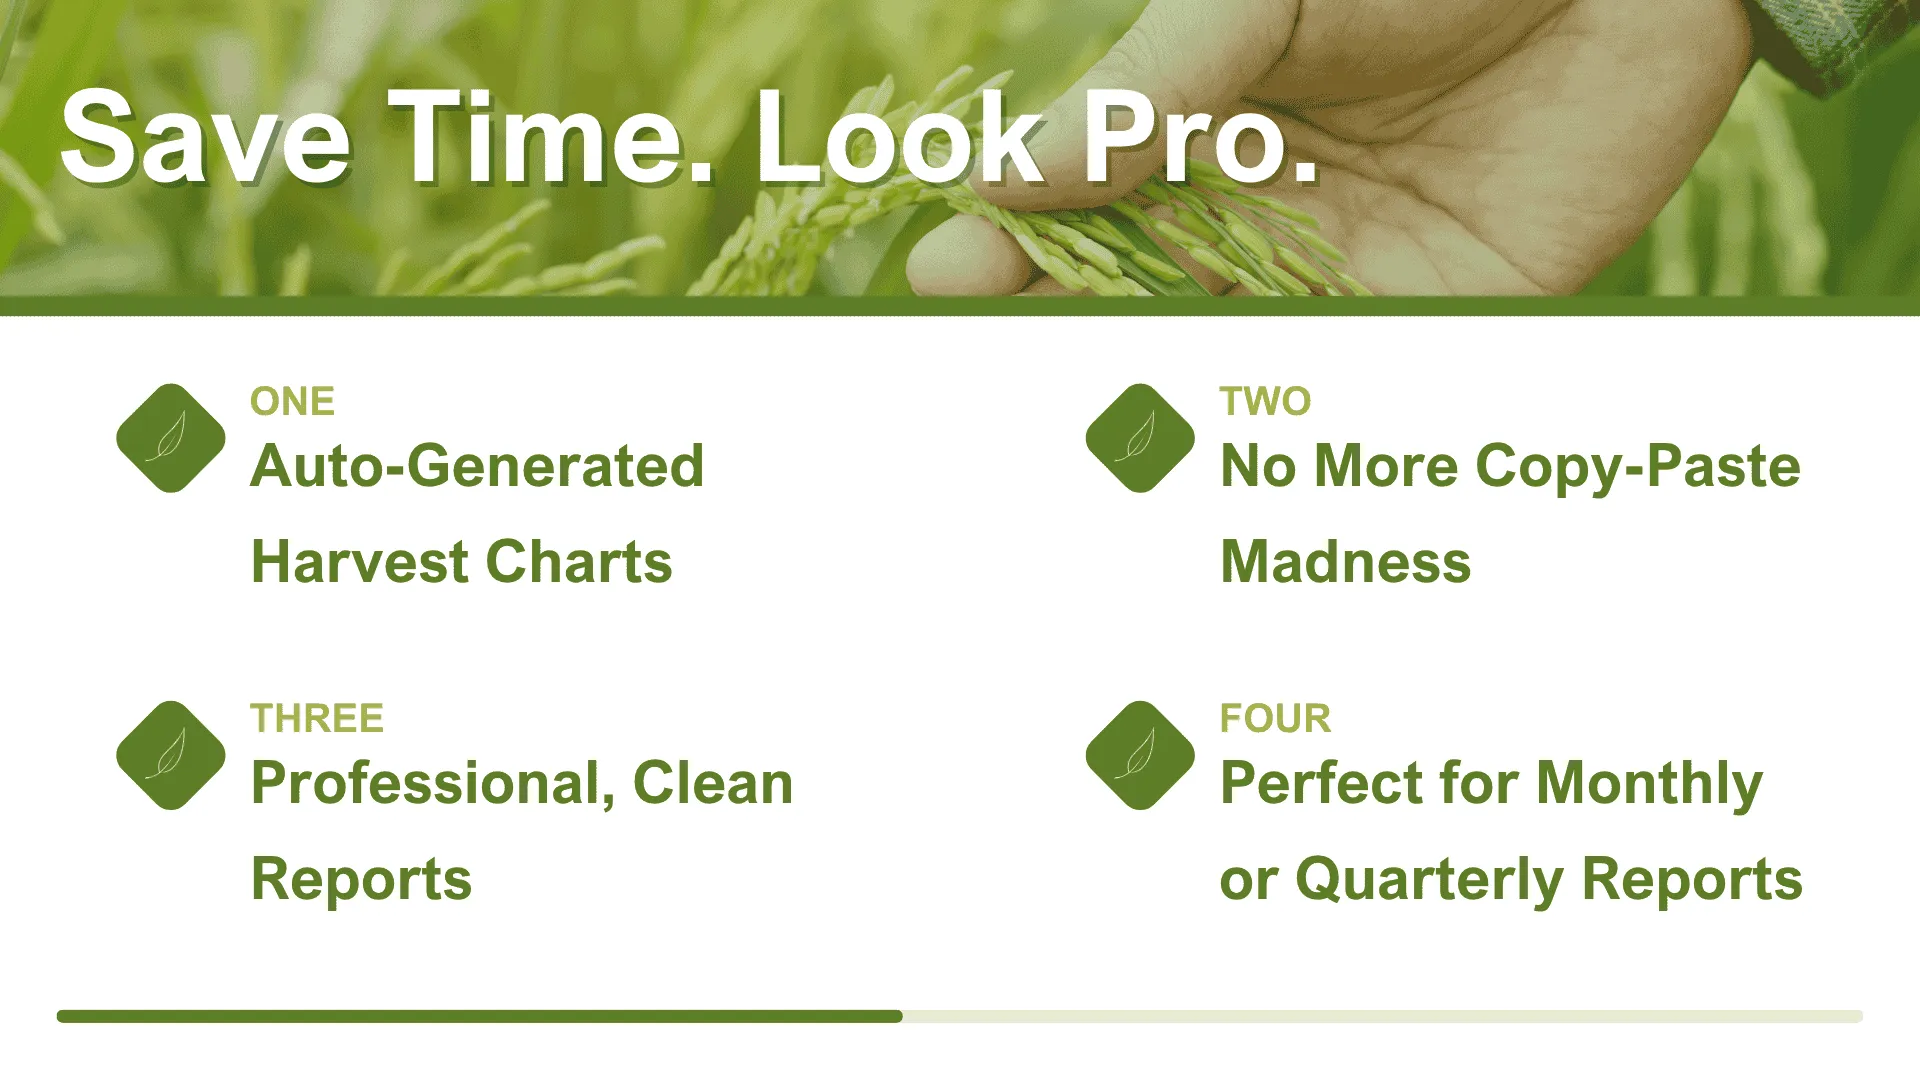
But here's the thing: it doesn't have to. We came across a free agricultural template designed specifically for creating an agribusiness PPT in minutes that's been a game-changer for many soybean farms. Thanks to automation features, it can save you 15+ hours every month on data sorting and presentation work. Here's how it helps:
✅ Auto-Generated Harvest Charts
Just enter your key data, and the system builds charts for you—like harvest per field, input-output ratios, and more.
✅ No More Copy-Paste Madness
The template updates all visuals and text automatically. Say goodbye to repetitive edits.
✅ Professional, Clean Reports
Visualized data looks sharp and makes your report more convincing—whether it's for buyers, banks, or internal reviews.
✅ Perfect for Monthly or Quarterly Reports
Whether you're doing a quick summary or a detailed analysis, this template handles both with ease.
Here's what one farmer told us: "What used to take me two full days now takes half a day—and looks way more professional.”
Alert: Common Error That Invalidates Your Data with MAPA Regulatory Formatting
Did you know a simple formatting issue—like a missing label or the wrong font—can actually get your whole agricultural report rejected by MAPA? It sounds extreme, but we've seen it happen more times than we'd like to admit.
Here are some of the most common (and costly) mistakes farmers make in their reports:
❌ Using fonts, colors, or charts that don't meet MAPA's visual standards
❌ Forgetting mandatory fields like land area or production units
❌ Charts missing time stamps or measurement units, making data unverifiable
❌ Disorganized structure that doesn't follow MAPA's template guidelines
🔥 And the worst part? These might seem like “small things,” but they can lead to:
• Rejected reports
• Delays in getting loans or subsidies
• Slowed approval of partnerships or certifications
That's why I always recommend using a MAPA-compliant agribusiness PPT or agricultural standards slides template. These templates are pre-built with the right structure, required fields, and formatting—so you're not guessing or risking hours of rework later.
Trust me, if you've ever had a report bounced back or just want to avoid that nightmare, this kind of tool is a total lifesaver.
Don't let a formatting glitch hold back your farm's progress. Start using a report template that's designed to pass on the first try.
Traffic Insights
Every harvest season, we see a big jump in farmers searching online for terms like “agro PPT” or “agricultural PPT templates.” We dug into search engine trends and found that during the busiest times on the farm, searches around agricultural reports, data summaries, and PPT creation skyrocket.
What does this tell us? Everyone's looking for faster, easier ways to organize their reports and showcase results without spending all day on it.
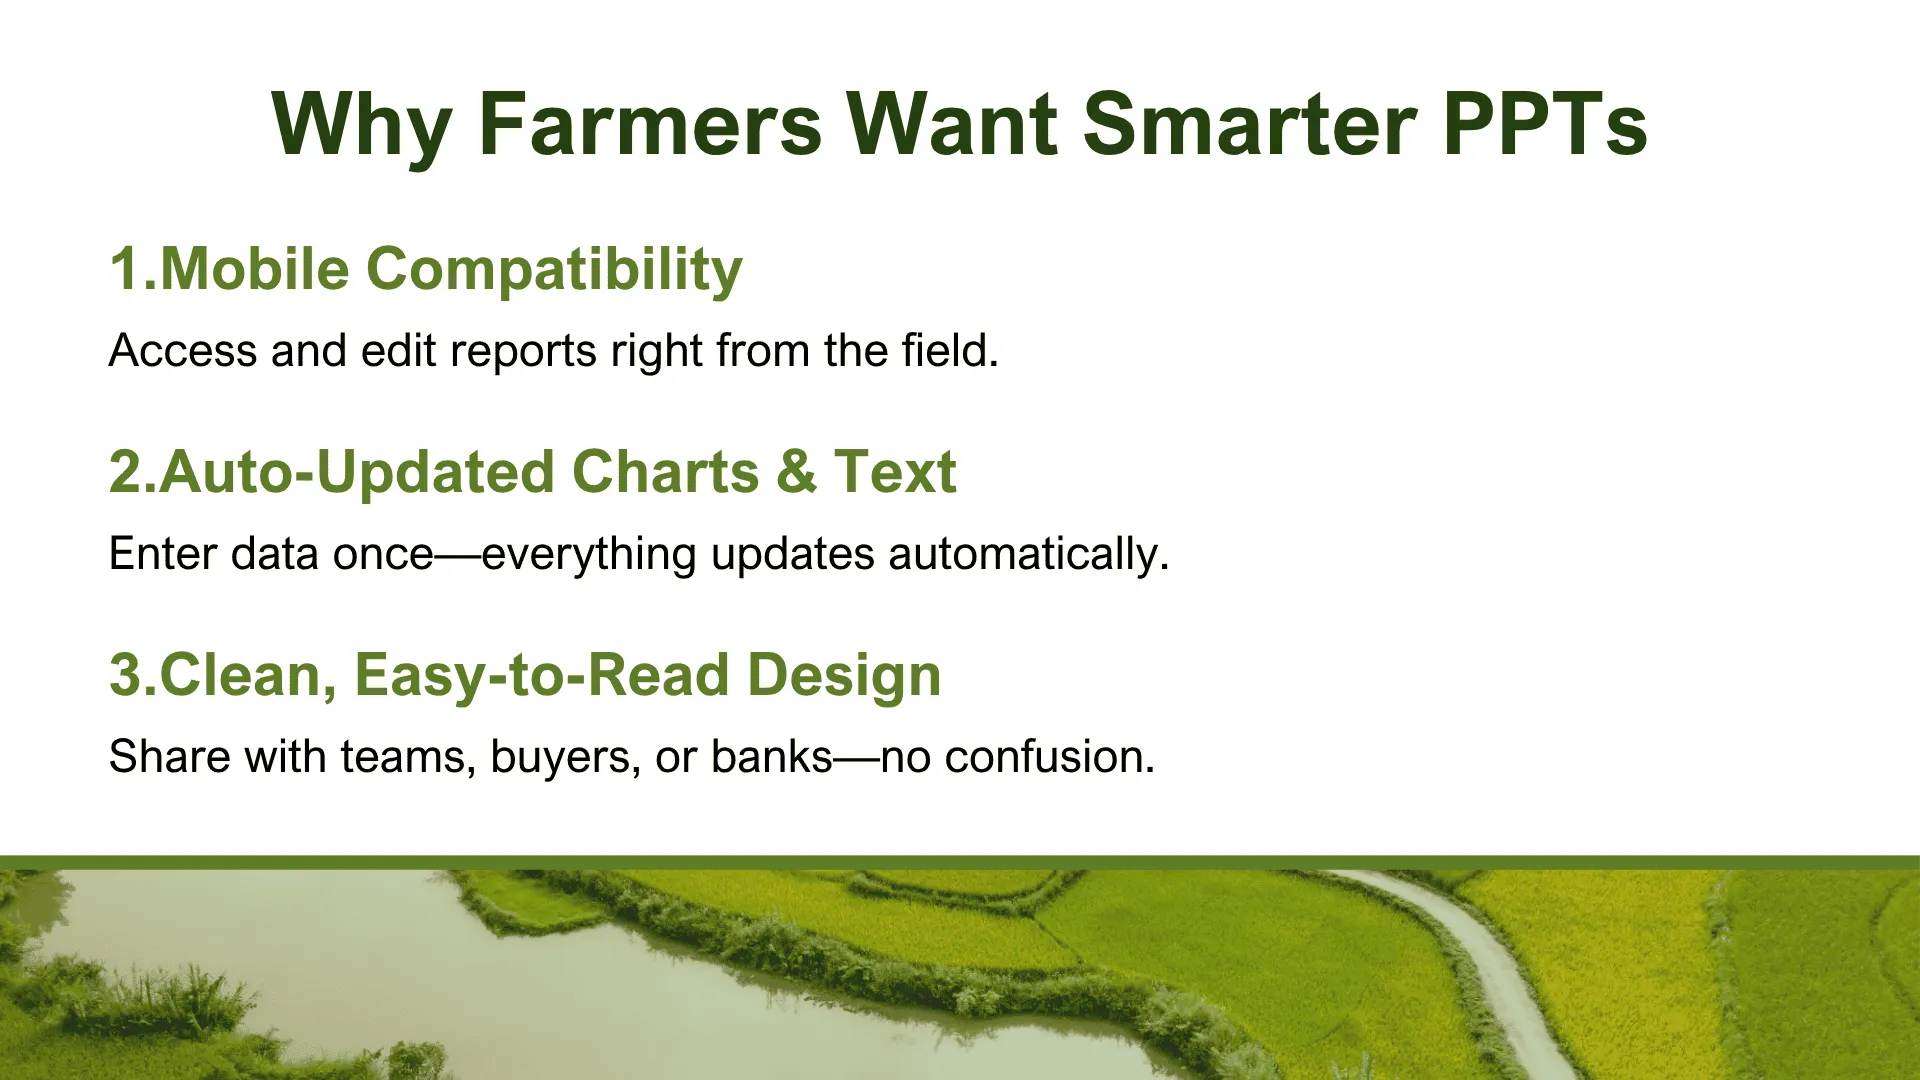
That's where a mobile-friendly, highly automated agribusiness PPT template really shines—especially if it includes features like automated harvest charts and comes as a free agricultural template:
• Works great on mobile devices
Farmers aren't always stuck at a desk—they're out in the fields checking data and taking notes. Having a template that runs smoothly on phones and tablets makes all the difference.
• Auto-updates charts and text
No more manual editing every time. Once you enter your data, the whole report updates itself, saving you tons of repetitive work.
• Clear, easy-to-understand design
It's not just about looking professional—it's about making your reports easy to follow, so you can confidently share them with your team, buyers, or banks.
The takeaway? When the farm is at its busiest, you need tools that save you time and energy. Choosing the right automated template isn't just about making a PPT—it's about giving yourself the freedom to focus on what really matters: running your farm.
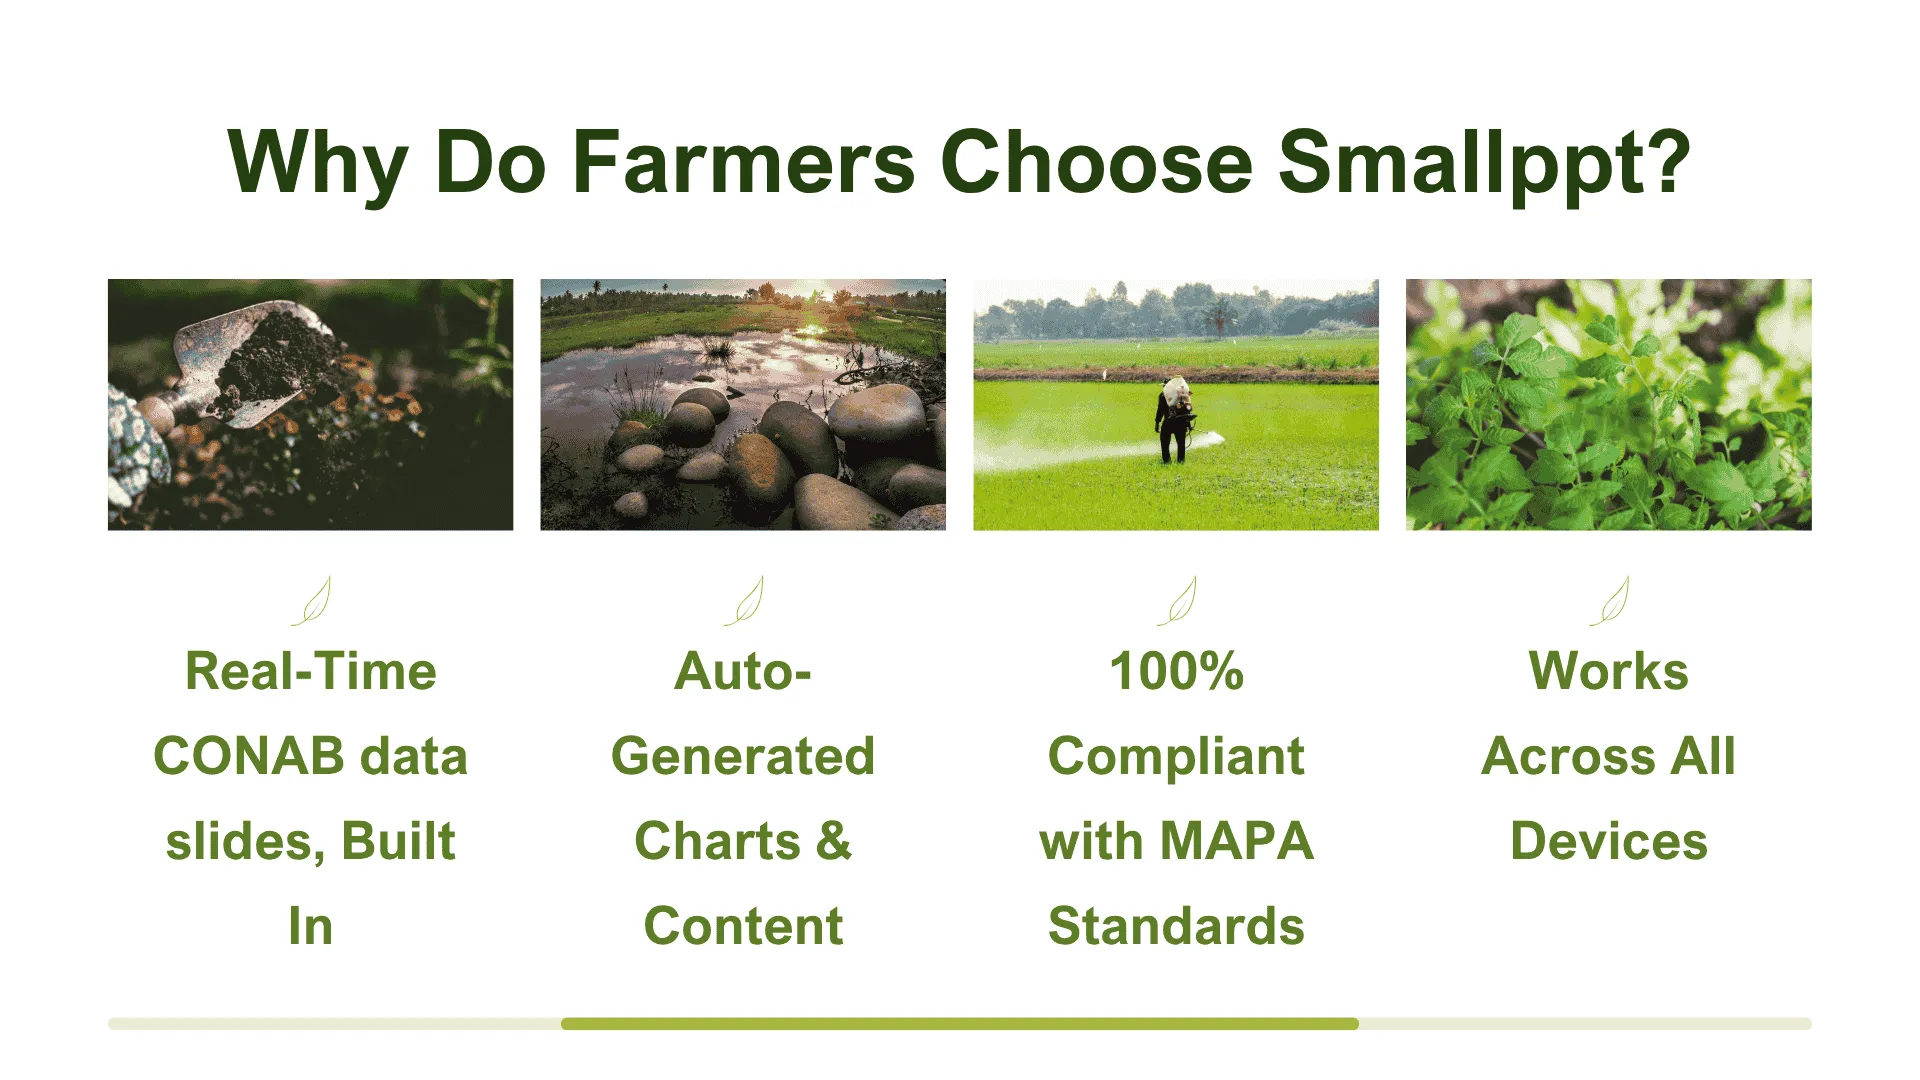
Why Do Farmers Choose Smallppt?
Smallppt isn't just another AI slide generator—it's built to help professionals (yes, including farmers) create reliable, high-quality presentations fast. When it comes to agricultural reporting, it hits all the right notes. Here's why so many farmers are switching to Smallppt:
• Real-Time CONAB data slides, Built In
No more copy-pasting or outdated numbers. Smallppt integrates the latest data from Brazil's CONAB—including commodity prices, supply & demand—directly into your slides. Your reports stay timely, accurate, and market-aware.
• Auto-Generated Charts & Content
Just input your farm data—like harvest, output, input-output ratios—and Smallppt instantly creates polished charts and clear, professional explanations. No design skills needed.
• 100% Compliant with MAPA Standards
From fonts and field labels to chart units and required sections, everything is formatted to meet Brazil's agricultural reporting rules. So you can skip the stress of rejected reports.
• Works Across All Devices
Whether you're on a laptop in the office or using a phone in the field, Smallppt adapts. Edit, preview, and share your reports wherever you are.
If you're tired of wasting time building reports from scratch—or worse, getting them rejected—Smallppt is hands-down one of the smartest tools you can use.
👉 Try it now at smallppt.com
Frequently Asked Questions in Agribusiness
Q1: What's an automated chart, and how does it work?
An automated chart is generated instantly based on the data you enter—no manual formatting required. Just plug in your numbers, and the system builds a clean bar, line, or pie charts for you.
Q2: Are Smallppt's templates really free?
Yes! Smallppt offers several free agricultural templates tailored to Brazilian reporting needs. You can also try out the full version with just one click—perfect for farms with growing reporting needs.
Q3: Do the templates actually meet MAPA's standards?
They sure do. Smallppt's templates are designed to follow MAPA's official reporting guidelines, including required fields, units, formatting, and structure—so your reports are always audit-ready.
Q4: How does Smallppt use CONAB data? Is it live?
Smallppt connects directly to CONAB's official data source. It regularly pulls in updated prices and supply/demand info, so your slides always reflect the real market.
Q5: Can I use Smallppt on my phone or tablet?
Absolutely. Smallppt works smoothly on mobile devices—so whether you're at your desk or walking the fields, you can create, review, and edit reports anytime, anywhere.