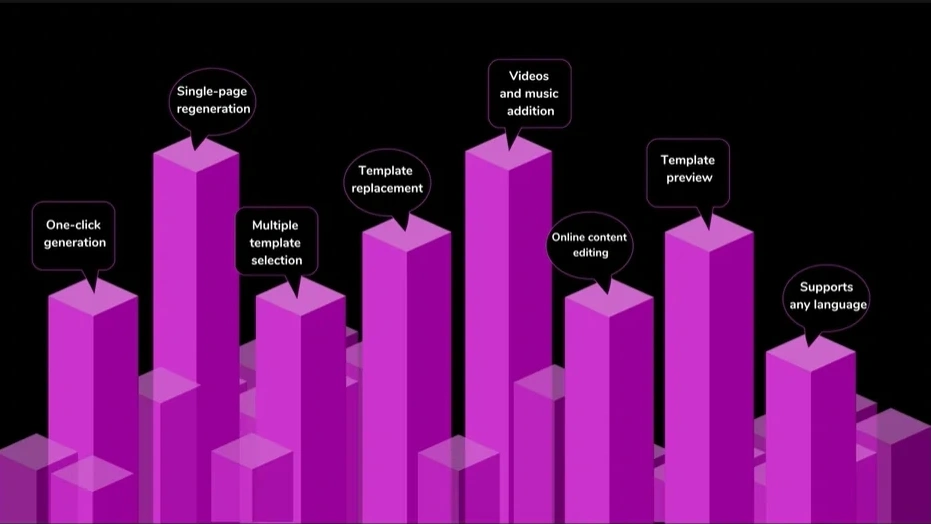
In the ever-evolving landscape of presentations, visual elements play a pivotal role in communicating complex information with clarity and impact. Microsoft PowerPoint, a versatile platform for presentation design, empowers users to create compelling infographics – graphical representations of data, knowledge, or ideas. This comprehensive guide navigates through the definition of infographics, explores the myriad benefits they bring to presentations, provides practical how-to guides for their creation, and concludes with insights into maximizing their potential for innovative content delivery.
1. Definition: Unraveling the Essence of Infographics in PowerPoint
Infographics are visual representations of information, data, or knowledge that blend text and graphics to convey complex concepts in a digestible format. In PowerPoint, infographics go beyond basic charts and graphs, encompassing a wide range of creative visual elements such as icons, images, and stylized text. They serve as powerful tools for condensing information into a visually appealing and memorable form.
2. Benefits: The Power of Visual Storytelling and Simplification
Clarity and Understanding: Infographics distill complex information into visually comprehensible forms, enhancing audience understanding.
Engagement: Visual elements capture audience's attention more effectively than text alone, fostering increased engagement.
Memorability: The combination of graphics and text enhances the memorability of key information, making it more likely to be retained.
Storytelling: Infographics enable the crafting of visual narratives, turning data points into stories that resonate with the audience.
Versatility: PowerPoint offers a diverse set of tools and features to create versatile and customized infographics that suit specific presentation needs.
3. How-to Guides: Mastering the Art of Infographic Creation
3.1 Planning Your Infographic:
Clearly define the purpose and message of the infographic.
Identify the key data points, facts, or concepts that need to be conveyed.
3.2 Choosing a Layout:
Decide on the layout that best fits your content (e.g., timeline, process flow, comparison).
Consider the visual hierarchy and flow of information within the infographic.
3.3 Inserting Shapes and Icons:
Utilize the "Shapes" and "Icons" features in the "Insert" tab.
Drag and drop shapes to represent elements of your infographic and complement them with relevant icons.
3.4 Incorporating Images:
Insert images that enhance the understanding of the content.
Use high-quality, relevant visuals that align with the theme of the infographic.

3.5 Stylizing Text and Fonts:
Experiment with different fonts and text styles to create a visual hierarchy.
Apply consistent formatting to maintain a polished and professional look.
3.6 Utilizing SmartArt:
Access the "SmartArt" feature to create visually appealing diagrams.
Choose the SmartArt type that aligns with your infographic's structure.
3.7 Adding Data Charts:
Insert data charts such as bar graphs, pie charts, or line graphs to represent numerical information.
Customize the chart colors and styles to match the overall design.
3.8 Using Animation:
Apply subtle animations to elements of the infographic to introduce them sequentially.
Use animation to guide the audience's focus and enhance the storytelling aspect.
4.Simplify Your Presentations: Smallppt's AI PowerPoint
Smallppt's AI PowerPoint, a presentation-simplifying AI PPT maker, streamlines design processes. This user-friendly online AI PowerPoint maker effortlessly crafts compelling presentations. The Redraw Feature refines text with precision, while real-time formatting recommendations from its Artificial Intelligence presentation PowerPoint suite enhance design dynamically. Integrated with Microsoft PowerPoint, it prioritizes efficiency, allowing a focus on substantive content. At the forefront of the AI for presentations movement, it seamlessly blends traditional design strengths with cutting-edge AI capabilities.
5. Conclusion: Elevating Information Delivery with Innovative Infographics
In conclusion, the art of designing innovative infographics in PowerPoint is a skill that transforms information into a visual masterpiece. The benefits of clarity, engagement, memorability, storytelling, and versatility underscore the importance of incorporating infographics effectively. As we navigate the dynamic landscape of presentations, let infographics be the storytellers that captivate and inform. By following the outlined how-to guides and embracing the potential of infographics, presenters can harness the full power of visual storytelling, leaving a lasting impression and ensuring that their content is not only understood but also remembered long after the presentation concludes. Innovative infographics, when wielded with creativity and purpose, become the visual anchors that elevate presentations to new heights.


