
In the retail industry, we frequently need to create business graphics for presentations, whether for internal team performance reviews or external official communications. Delivering a clear, compliant, and visually appealing presentation is therefore crucial.
But many people encounter difficulties when creating them: either the presentation style of traditional templates has issues, or they want to reference the reporting style of leading brands like the OXXO style presentation, but can't find ready-made sales PPT templates; or they struggle to find suitable templates that match requirements like those for SAT sales data.
Today, we’ll detail how to solve these problems, helping you easily master sales data visualization and automatic chart generation skills.
How to Present Sales Data in PowerPoint
1. Clarify the Core Principles of Data Presentation
Data presentation should focus on 1-2 key conclusions per slide, label data sources and periods for accuracy, and adjust content emphasis based on different audiences (e.g., management, execution teams) to avoid information redundancy or misalignment.
2. Choose Appropriate Chart Types
- Trend Data: Use Line Charts
Applicable Scenarios: Display changes in sales revenue or volume over time (e.g., monthly/quarterly sales trends).
- Proportion Data: Use Pie or Donut Charts
Applicable Scenarios: Show the proportion of sales revenue by region/product (e.g., “North China region accounts for 30% of total sales revenue”).
- Comparative Data: Use Bar Charts
Applicable Scenarios: Compare data across different dimensions (e.g., sales revenue by region, year-over-year data by quarter).
- Extreme Value Data: Use Horizontal Bar Charts
Applicable Scenarios: Display the top 5/bottom 5 products or regions by sales revenue, highlighting data ranking.
3. Optimize Layout and Details
The layout should simplify text, unify formatting, and emphasize key data and conclusions. Control the proportion of charts per slide to no more than 70% and limit to 2 charts, balancing information delivery and visual comfort.

Traditional Sales PPT Templates VS. Smallppt
Traditional PowerPoint templates provide static design frameworks, relying on users to manually fill in content and handle design work. In contrast, Smallppt, as an AI presentation tool, can automatically generate structured slides and data charts, transforming the creation process from manual editing to intelligent generation, significantly boosting efficiency and consistency.
1. Key Issues with Traditional Sales PPT Templates for Sales Data
▲ Inefficient Information Delivery
- Excessive text content: To explain data context and logic, lengthy explanatory text is often added, cluttering slides. This easily distracts the audience, making it hard for them to quickly grasp key data conclusions.
- Blurred data highlights: A lack of emphasis on critical data makes it difficult for the audience to swiftly identify business priorities.
▲ Underwhelming Visual Presentation
- Static, non-interactive graphics: Most business graphics used here are static, unable to dynamically demonstrate data change processes (e.g., gradual shifts in quarterly sales trends). This results in weak visual impact.
▲ Poor Adaptability
- Inappropriate chart selection: For example, using line charts to display regional proportions contradicts the functional nature of these charts, causing confusion in data interpretation and reducing information delivery efficiency.
2. Advantages of Smallppt’s Templates
▲ Easy Operation, Efficient Generation of Professional Graphics
- Supports one-click editing of Graphics: No professional design skills required. Simply click to adjust a graphic’s style, color, or data, Smallppt will quickly generate business graphics that meet your needs and save production time.
- Pre-set data placeholders: Includes placeholders for INEGI data; directly input figures, and the layout will automatically adapt to ensure standardized data presentation.
▲ Compliance and Adaptability
- Pre-set SAT-compliant color schemes: For instance, use #FF6B00 to highlight key data—no extra color adjustments needed when presenting SAT sales data.
▲ Diverse Styles, Catering to Popular Demands
- Covers a range of style templates: Includes vibrant, professional templates akin to OXXO-style presentations, enhancing presentation recognition and sophistication.
- Rich visual presentation: Supports multiple visualization formats, clearly displaying data trends to make sales figures more visually impactful and easier for audiences to understand.
Step - by - Step Example
Now that you’ve gotten a sense of Smallppt template advantages, you might be curious exactly how to use them to build sales presentations. No worries—we’ll walk you through detailed step-by-step examples, complete with operation screenshots and dynamic demos, so you can easily get the hang of it and quickly generate presentations with professional business graphics.
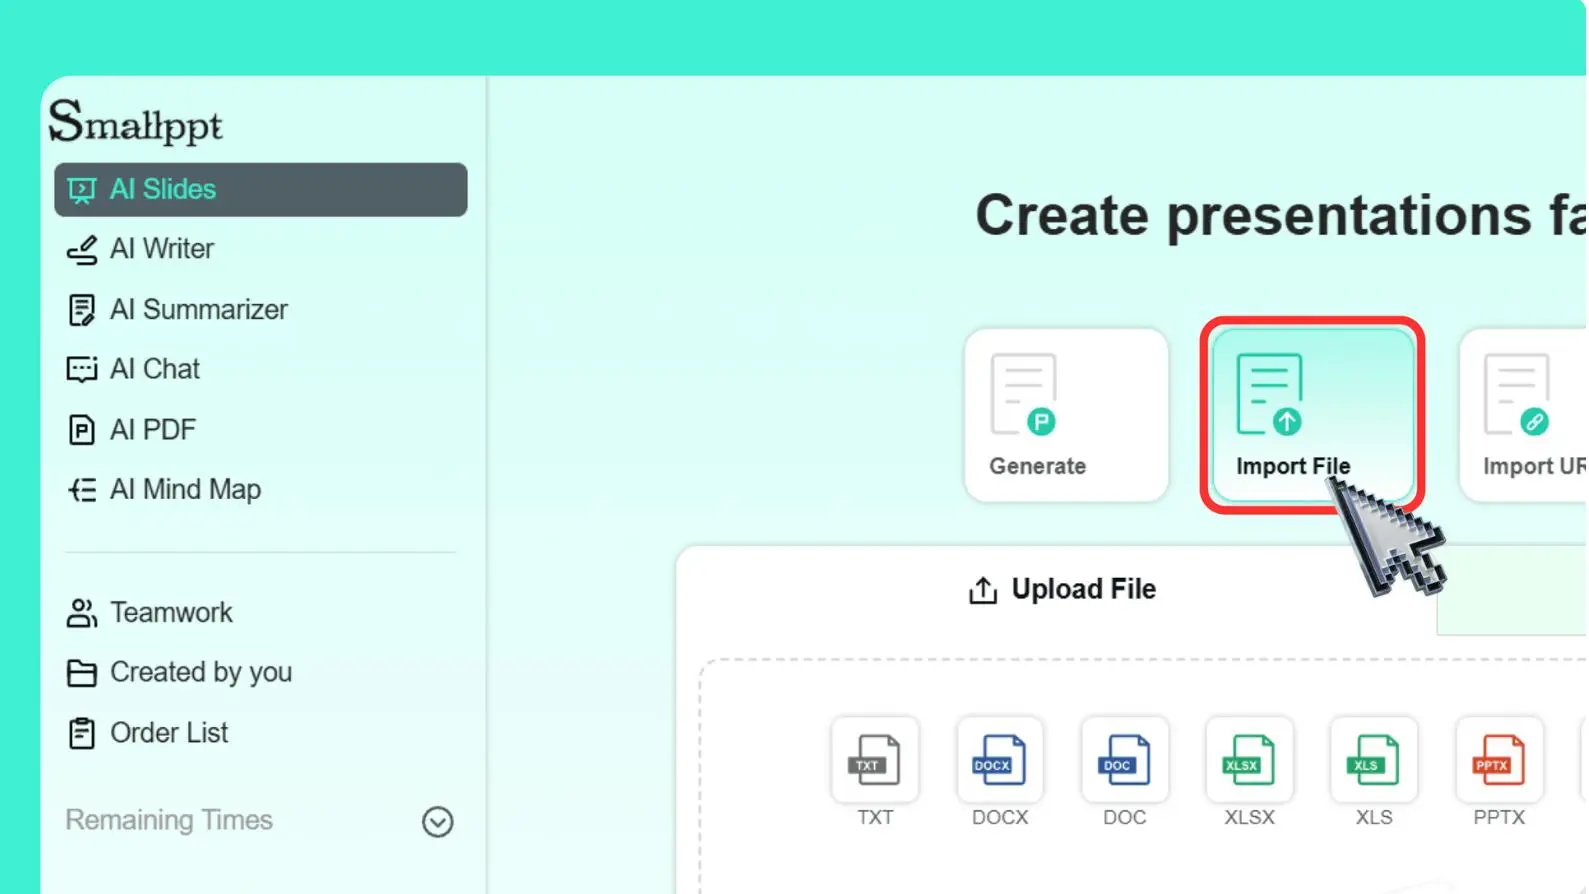
- Choose "Import File" to get started
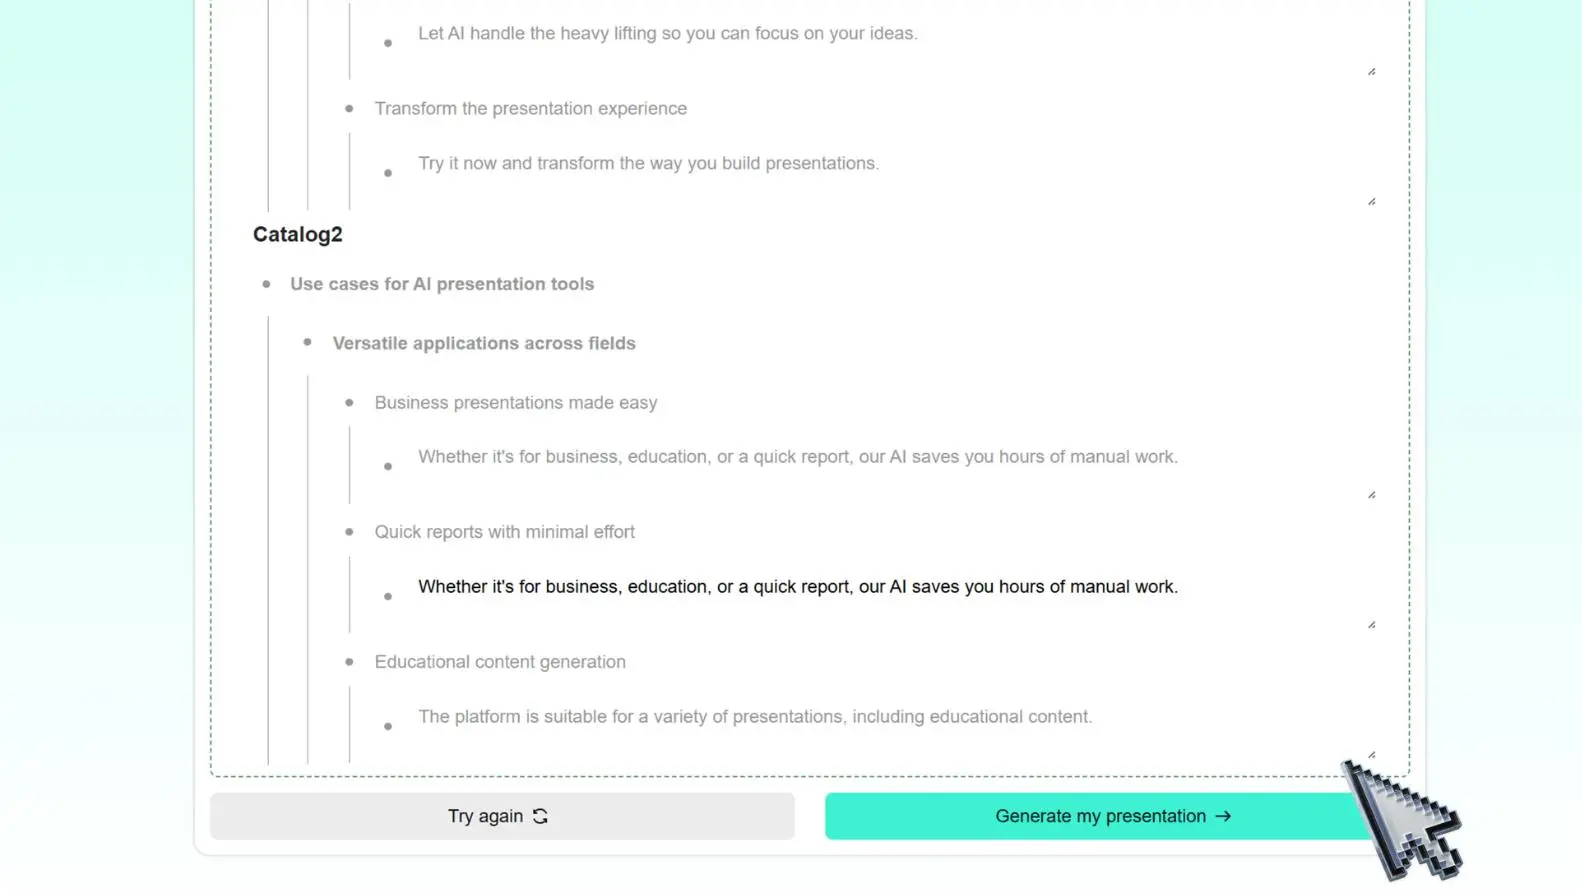
- Generate your outline
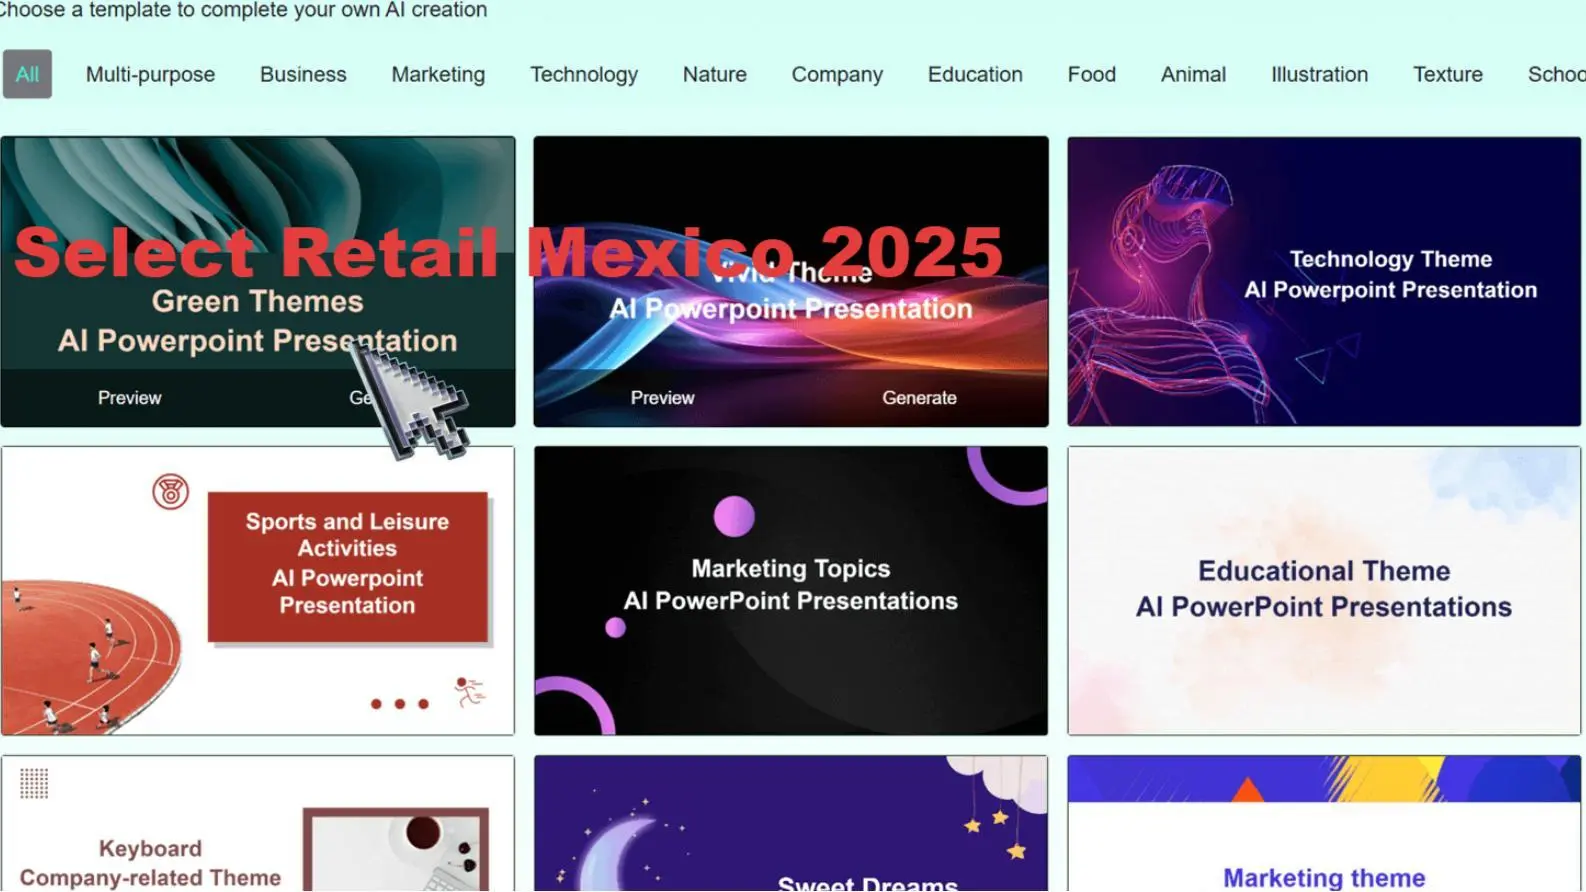
- Pick a sales PPT template
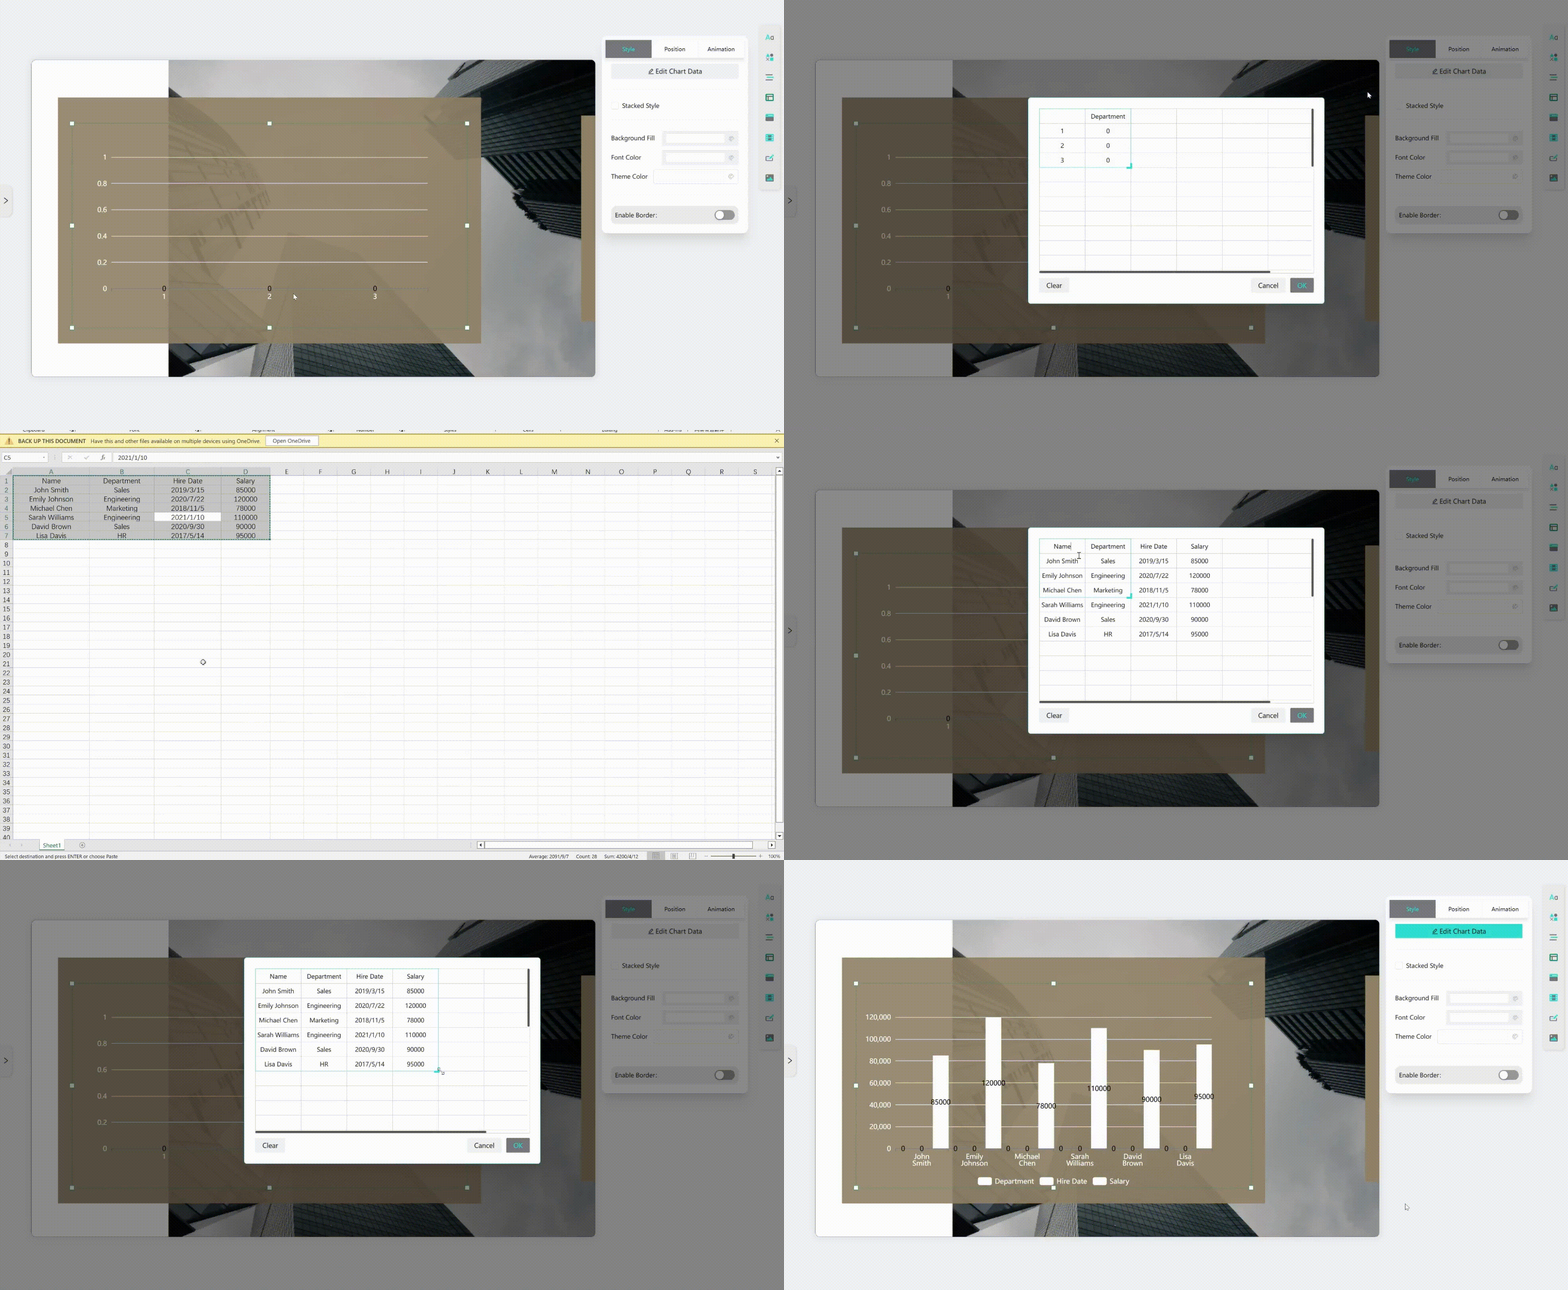
- Replace data
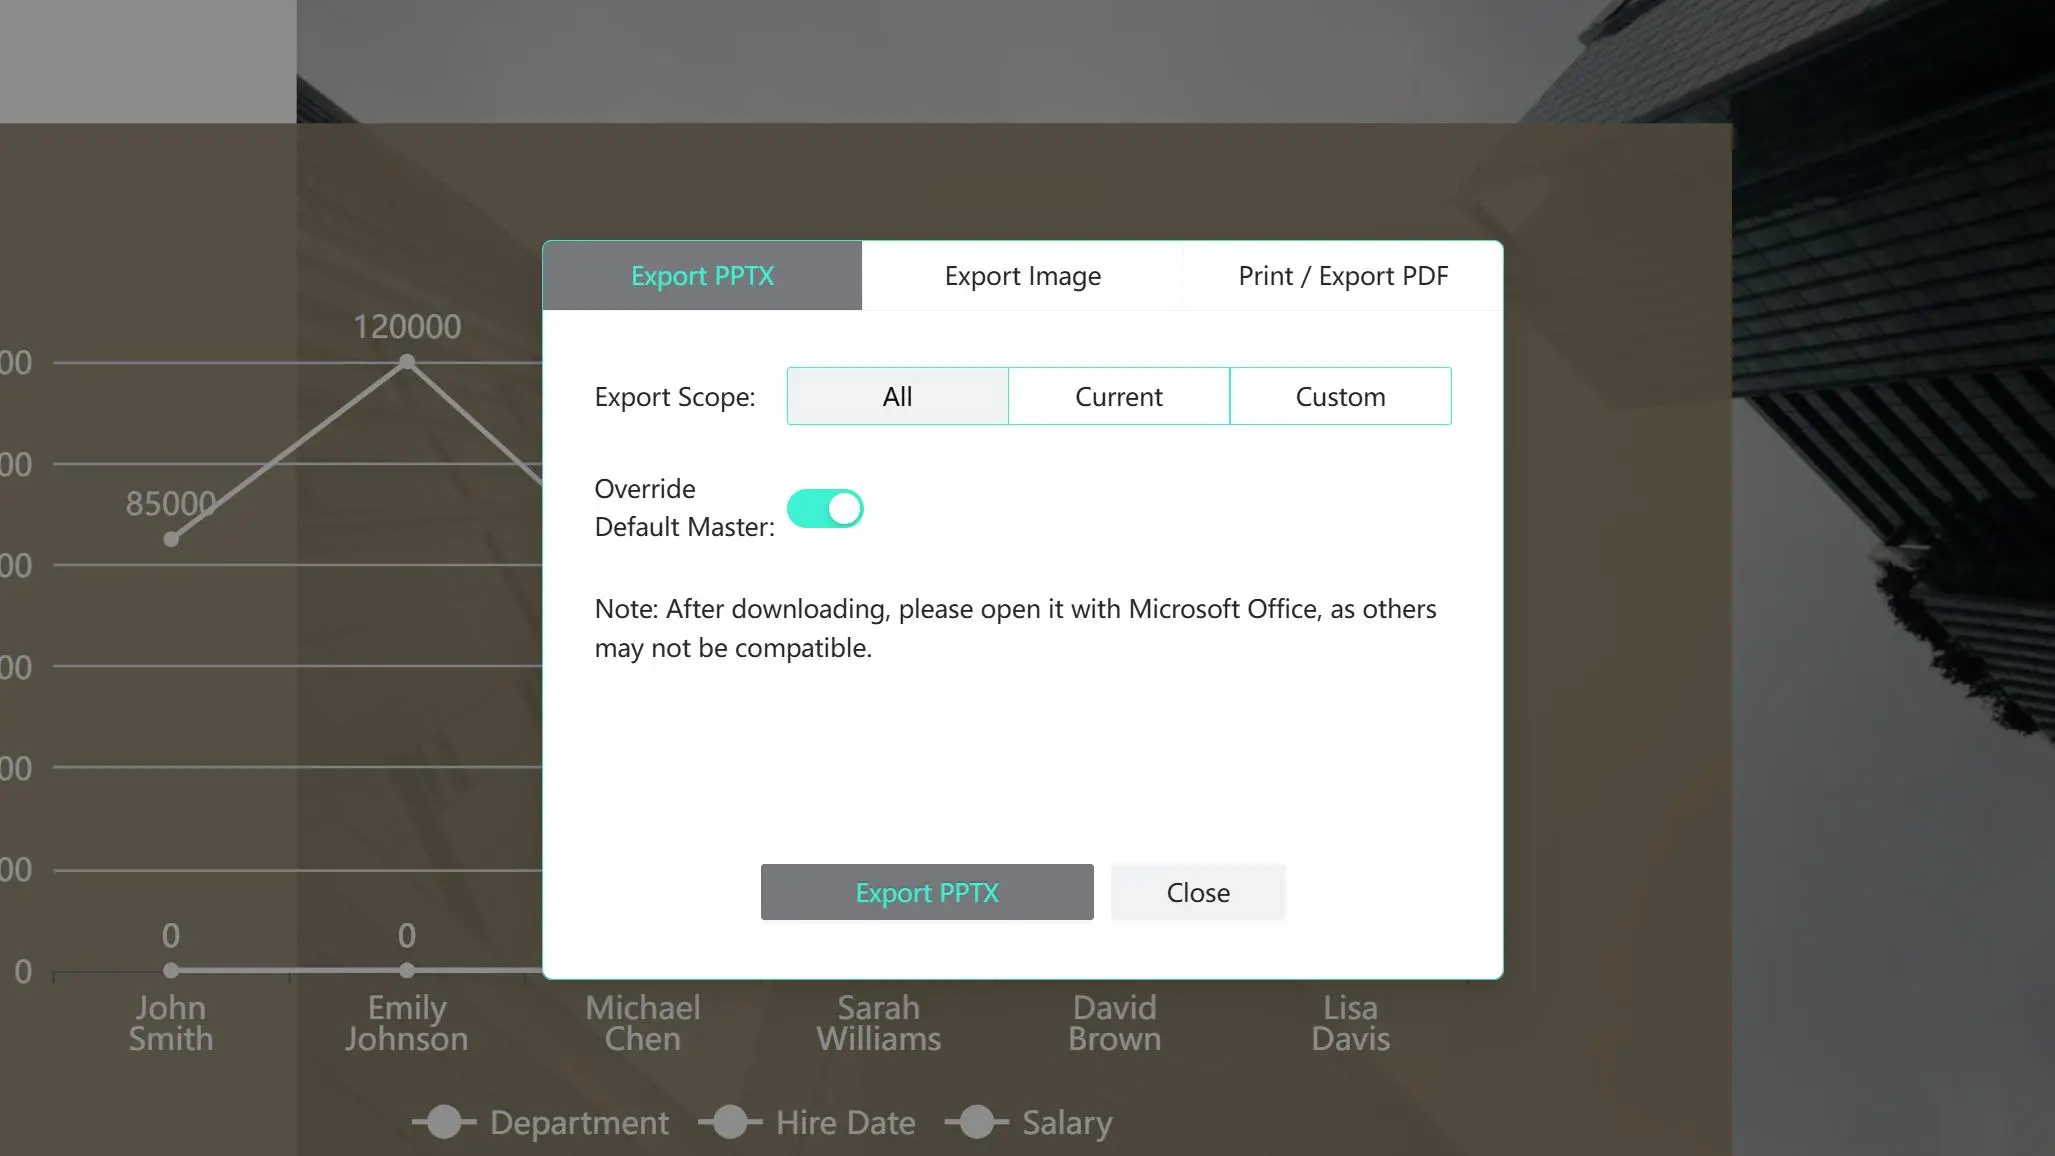
- Download
Real Case: A Mexican Retail Professional's Experience with Smallppt
To more authentically showcase how Smallppt's sales PPT templates can support retail work, let's hear from a real retail professional in Mexico. He shares a comparison of his experience before and after using the templates, highlighting the changes they brought, making sales data presentations more efficient and professional.
Carlos, a convenience store manager in Mexico City, had to submit a monthly sales presentation to headquarters. When using traditional methods, his slides were filled with dense tables—dozens of product sales and revenue figures crammed onto a single page. Headquarters managers often spent several minutes searching for key data, and Carlos himself spent about four hours each month preparing the report, repeatedly adjusting table formats to prevent text overlap.
After switching to Smallppt, he simply imports Excel data, and the template automatically generates bar charts for sales volume and doughnut charts for profit margins. Within the generated presentation, he can highlight declining soda sales in red, making key insights immediately clear. Now, it takes him only 40 minutes to prepare the presentation, and during meetings, headquarters can grasp the core message in just one minute.
This real-world experience from a Mexican retail professional shows that Smallppt’s sales PPT templates effectively address the core pain points of traditional table-heavy slides. They significantly reduce preparation time, minimize formatting struggles, improve the clarity of sales data displays, and ensure compliance—all while boosting productivity and lowering communication costs.
Stop Struggling with Slides, Create Data-Driven Presentations Instantly
If you've ever spent too much time creating repetitive data reports, you've now found the solution. At its core, Smallppt makes data presentation simpler and more efficient than ever—freeing you to focus on what truly matters: the analysis itself, not slide design.
1. Extensive Template Library for All Scenarios
Smallppt offers an extensive library of professional templates covering a wide range of business needs such as sales reports, market analysis, and financial reviews.
In addition to templates that capture the vibrant, clean, and professional style of OXXO-style presentations, it also provides designs suitable for various industries and global companies. This helps users easily align with brand guidelines and quickly produce polished slides tailored to any situation.
2. Simple & Efficient Operation, No Design Skills Needed
Smallppt comes with automated chart generation—just drag and drop your data, and it instantly visualizes retail metrics like SAT sales data, generating various professional business graphics such as bar charts, line graphs, and pie charts.
3. User-Friendly Experience, Balancing Practicality & Efficiency
Smallppt is designed with user care in every detail: an intuitive interface lets you create full presentations using keywords, while built-in collaboration and version history features make team editing and content tracking seamless.

Final Thoughts
We hope this article helps you handle sales data reporting more efficiently. Whether you need to quickly generate clear business graphics or are looking for professional sales PPT templates, Smallppt is designed to simplify your workflow through intuitive operation and practical design—allowing you to focus more time on analysis and decision-making.
If you'd like to experience this efficiency boost firsthand, feel free to give it a try now.


